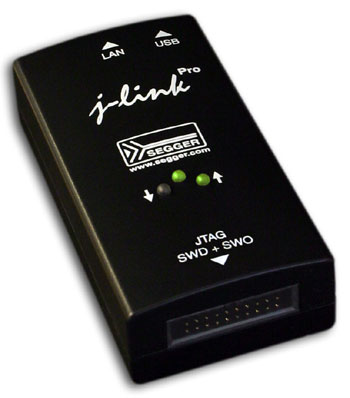
J-Link Debug Probes
SEGGER J-Links are the most widely used line of debug probes available today. They've been proven for more than 10 years with over 250,000 units sold, including OEM versions and on-board solutions. This popularity stems from the unparalleled performance, extensive feature set, large number of supported CPUs, and compatibility with all popular development environments.
With up to 3 MBytes/s download speed to RAM and record breaking flashloaders, as well as the ability to set an unlimited number of breakpoints in flash memory of MCUs, the J-Link debug probes are undoubtedly the best choice to optimize your debugging and flash programming experience.

J-Link debug probes support all ARM 7/9/11, Cortex™, Renesas RX™ CPUs and are supported by all major IDEs such as IAR EWARM, Keil MDK,Rowley CrossWorks, Atollic TrueSTUDIO, IAR EWRX,Renesas HEW, Renesas e2studio, including GDB based IDEs, and many others.
Hardware featuresHardware features like Ethernet interface, USB full- / high-speed interface, etc. are J-Link model specific features which can not be updated or changed by software updates.
| J-Link BASE | J-Link PLUS | J-Link ULTRA+ | J-Link PRO | J-Trace for Cortex-M | J-Trace ARM | |
|---|---|---|---|---|---|---|
| Download speed into RAM1 |
1.0 MByte/sec | 1.0 MByte/sec | 3.0 MByte/sec | 3.0 MByte/sec | 3.0 MByte/sec | 1.0 MByte/sec |
| Max. target interface speed | 15 MHz | 15 MHz | 50 MHz | 50 MHz | 25 MHz | 12 MHz |
| Max. SWO speed | 7.5 MHz | 7.5 MHz | 100 MHz | 100 MHz | 25 MHz | |
| USB | ||||||
| Ethernet | ||||||
| JTAGinterface | ||||||
| SWD interface | ||||||
| SWO interface | ||||||
| Microchip ICSP® interface |
||||||
| Renesas FINE interface | ||||||
| ETM Trace | ||||||
| ETB Trace |
Key:
IncludeNot Include
Software features
Software features are features implemented in the software primarily on the host. Software features can either come with the J-Link or be added later using a license string from Segger.
| J-Link BASE | J-Link PLUS | J-Link ULTRA+ | J-Link PRO | J-Trace for Cortex-M | J-Trace ARM | |
|---|---|---|---|---|---|---|
| GDB Server | ||||||
| Flash Download2 | ||||||
| Unlimited Flash Breakpoints3 | ||||||
| J-Flash | ||||||
| RDI | ||||||
| RDDI |
Key:
IncludeSupported cores
Support for additional / new cores may be added to existing J-Link models with a new firmware version as far as the exisiting J-Link hardware allows it.
| J-Link BASE | J-Link PLUS | J-Link ULTRA+ | J-Link PRO | J-Trace for Cortex-M | J-Trace ARM | |
|---|---|---|---|---|---|---|
|
ARM legacy cores |
||||||
| ARM7 |
|
|
|
|
|
|
| ARM9 |
|
|
|
|
|
|
| ARM11 |
|
|
|
|
||
|
ARM Cortex cores |
||||||
| Cortex-A5 |
|
|
|
|
||
| Cortex-A7 |
|
|
|
|
||
| Cortex-A8 |
|
|
|
|
||
| Cortex-A9 |
|
|
|
|
||
| Cortex-A12 |
|
|
|
|
||
| Cortex-A15 |
|
|
|
|
||
| Cortex-A17 |
|
|
|
|
||
| Cortex-MO |
|
|
|
|
|
|
| Cortex-MO+ |
|
|
|
|
|
|
| Cortex-M1 |
|
|
|
|
|
|
| Cortex-M3 |
|
|
|
|
|
|
| Cortex-M4 |
|
|
|
|
|
|
| Cortex-M7 |
|
|
|
|
|
|
| Cortex-R4 |
|
|
|
|
||
| Cortex-R5 |
|
|
|
|
||
| SC000 (M0 secure) |
|
|
|
|
|
|
| SC300 (M3 secure) |
|
|
|
|
|
|
|
Microchip PIC32 |
||||||
| Microchip PIC32MX |
|
|
|
|
||
| Microchip PIC32MZ |
|
|
|
|
||
|
Renesas RX |
||||||
| Renesas RX110 |
|
|
|
|
||
| Renesas RX111 |
|
|
|
|
||
| Renesas RX210 |
|
|
|
|
||
| Renesas RX21A |
|
|
|
|
||
| Renesas RX220 |
|
|
|
|
||
| Renesas RX610 |
|
|
|
|
||
| Renesas RX621 |
|
|
|
|
||
| Renesas RX62G |
|
|
|
|
||
| Renesas RX62N |
|
|
|
|
||
| Renesas RX62T |
|
|
|
|
||
| Renesas RX630 |
|
|
|
|
||
| Renesas RX631 |
|
|
|
|
||
| Renesas RX63N |
|
|
|
|
||
| Renesas RX63T |
|
|
|
|
||
Key:
Not supported
- For use from within an IDE
- Best value: Includes all software enhancements and maximum performance
Educational use
- Price does not include VAT or Sales Tax which may be applicable in some regions
- Cortex-M3,4 cores only
- ARM 7/9 cores only
- The download speeds listed here are the peak download speeds that can be achieved by the particular J-Link model.The actual download speed may be lower as it depends on various factors, such as, but not limited to: The selected debug interface & speed, the CPU core and its operating frequency, other devices in the JTAG chain in case JTAG is used as target interface.
For customers who want to build their own applications using J-Link, and for IDE vendors who implement J-Link support for their IDE, SEGGER offers a J-Link SDK which comes with the J-Link DLL + API documentation + implementation samples. The SDK is available for Windows and Linux.
Remote Server Debugging in Tunnel ModeThe J-Link Remote Server effortlessly debugs target hardware and application in remote locations over TCP/IP as if the target was on the developer's desk. Taking this concept to the next level, SEGGER offers a tunnel mode for remote debugging anywhere in the world.
Tunnel mode initiates the connection sending the serial number of the J-Link to the tunnel server. The J-Link DLL then is capable of creating a tunnel connection via the server just by using the serial number of the target J-Link.
Support engineers can debug unwieldy hardware at the customer's site without having to travel there, just by sending a J-Link. Distributed development teams can share early prototypes even in remote locations.
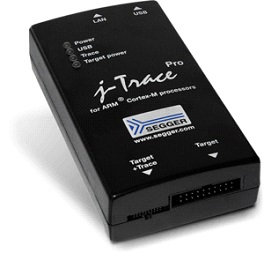
J-Trace

J-Trace PRO for Cortex-M-The Leading Trace Probe
- Trace and streaming probe
- Real-time streaming of events and system ticks
- Tune your application with live profiling
- Satisfy regulatory requirements with instruction-level code coverage
- Isolate and Identify hard-to-find code defects with unlimited trace
- Supports Streaming Trace
- Supports Cortex-M0/M0+/M1/M3/M4/M7 targets
- Full J-Link debug functionality

